Real Estate Valuation Framework: Intrinsic Cost & Exit Rules
 The OD Team Main Writer & Editorial Team 17 min read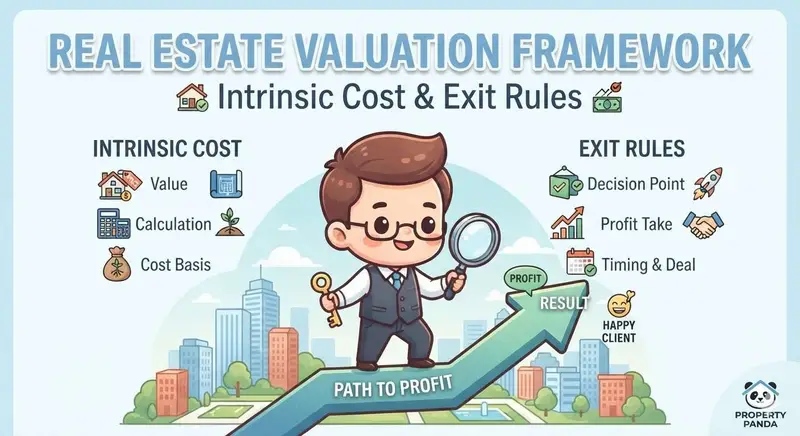
The Intrinsic Valuation of Real Estate: Deconstructing Cost, Premium Arbitrage, and Liquidation Thresholds
In the luxury automotive sector, pricing mechanics operate largely within the framework of Veblen economics. When a vehicle commands anywhere between $100,000 and several million dollars—as seen with marques like BMW, Bentley, or Rolls-Royce—brand equity, bespoke coachbuilding, and manufactured exclusivity decouple the retail sticker price from the raw input costs of steel, aluminum, silicon, and assembly labor. Most buyers cannot quantify the precise engineering cost differences between an assembly-line sedan and a handcrafted grand tourer; they purchase prestige, status signaling, and mechanical pedigree.
Retail real estate buyers routinely make the catastrophic error of assuming that residential property operates on this same brand-first premium model. Captivated by elaborate sales galleries, photorealistic architectural renderings, and celebrity brand ambassadors, homebuyers and retail investors systematically conflate price with value.
As Warren Buffett famously codified: “Price is what you pay; value is what you get.”
When acquiring an asset class that typically represents the single largest capital allocation of a person’s lifetime, relying on developer brochures and broker sentiment is a recipe for long-term financial underperformance. To build generational wealth, buyers must approach residential underwriting with the analytical rigor of an institutional private equity analyst.
By deconstructing the unit economics of land acquisition, construction costs, statutory infrastructure charges, comparative micro-market arbitrage, and terminal yield thresholds, one can determine with precision whether an apartment is an asymmetric investment opportunity or an overleveraged liability.
The Regulatory Revolution: Real Estate Disclosures as an Equity Research Terminal
Historically, residential real estate in developing and mature markets alike operated within an information vacuum. Developers held an asymmetric advantage, concealing land acquisition figures, actual buildable density, and approval charges.
The implementation of robust regulatory statutory bodies—such as the Real Estate Regulatory Authority (RERA) framework in India—has systematically dismantled this information asymmetry. Statutory filing portals now act as the functional equivalent of corporate SEC 10-K filings or statutory audit reports.
Every registered developer is legally mandated to upload their project registration application before accepting a single dollar or rupee from retail buyers. This legal dossier lays bare the financial and physical anatomy of the project, including:
- Total Land Acquisition Cost: The actual transactional or audited book value of the underlying land parcel.
- Gross Parcel Area: Total land size measured in square meters or acres.
- Total Sanctioned Built-Up Area: The aggregate floor area permitted for development under zoning laws.
- Estimated Direct Development Costs: Segmented into civil construction, mechanical, electrical, and plumbing (MEP) infrastructure, and statutory government levies.
- Statutory Infrastructure Levies: External Development Charges (EDC) and Internal Infrastructure Development Charges (IDC).
When you access a state’s regulatory repository—such as HRERA for the Gurgaon/National Capital Region micro-market—you no longer have to guess what a property is worth. You can calculate its intrinsic cost of production down to the exact unit of measurement.
Framework 1: The Intrinsic Cost-Plus (Bottom-Up) Valuation Model
The foundational method for evaluating under-construction high-rise residential projects is the Intrinsic Cost-Plus Model. This model answers an essential question: What does it physically cost the developer to deliver one square foot of saleable space?
Intrinsic Cost per Sq. Ft. = Land Cost/Sq. Ft. + Construction Cost/Sq. Ft. + Infrastructure Levies/Sq. Ft. + Capitalized Overheads & Statutory Taxes
If the developer’s asking price is within a 5% to 8% margin of this baseline figure, the buyer is acquiring the asset near its net asset value (book value). If the asking price sits at a 40% to 60% premium without demonstrable land-scarcity justification, the asset is drastically overpriced.
+-----------------------------------------------------------------------+
|                THE INTRINSIC COST-PLUS WATERFALL MODEL                |
+-----------------------------------------------------------------------+
|  [Land Acquisition Cost]      -->  Total Land Cost / Saleable Sq. Ft. |
|            +                                                          |
|  [Hard Construction Costs]    -->  Civil + MEP + Finishes per Sq. Ft. |
|            +                                                          |
|  [Statutory Infra Charges]    -->  EDC + IDC + Licensing per Sq. Ft.  |
|            +                                                          |
|  [Soft Costs & Overhead]      -->  Marketing + Approvals + GST        |
+-----------------------------------------------------------------------+
                                    ||
                                    \/
              [BASE INTRINSIC VALUE (Zero-Margin Floor)]
                                    ||
                                    \/
       Compare Against: [DEVELOPER ASKING PRICE (Per Sq. Ft.)]
1. Land Cost Allocation per Square Foot
Calculating the land cost per square foot does not mean dividing the cost of the raw land by the land’s physical surface area. Real estate is vertical; land value must be amortized over the total saleable (super built-up) area.
$$\text{Land Cost per Sq. Ft.} = \frac{\text{Total Land Acquisition Cost}}{\text{Total Permissible Saleable Area}}$$
Step-by-Step Mathematical Formulation:
-
Locate Land Cost: Extract the audited land cost figure from the statutory RERA application.
-
Determine Total Saleable Area: Identify the total sanctioned built-up area in square meters. Convert this figure to square feet using the standard conversion factor:
$$\text{Area in Sq. Ft.} = \text{Area in Sq. Meters} \times 10.7639$$
-
Normalize Multi-Configuration Variance: A common dilemma retail buyers face is how to apportion land cost between a 2-bedroom (e.g., 1,400 sq. ft.) and a 4-bedroom (e.g., 3,200 sq. ft.) apartment within the same complex. The solution is straightforward: calculate strictly on a blended per-square-foot basis. The larger configuration naturally carries its proportionate share of the land cost simply by virtue of its larger total square footage.
2. Hard Construction Costs per Square Foot
Construction expenses vary depending on structural design, seismic engineering, elevation treatments, and interior specifications. In institutional Tier-1 micro-markets, construction standards fall into three distinct quality bands:
- Mass Housing / Value Segment: ₹1,800 to ₹2,200 per sq. ft. Basic RCC framing, standard aluminum formwork, standard vitrified tile flooring, basic exterior acrylic paint.
- Premium High-Rise (Grade-A Developer): ₹2,500 to ₹2,800 per sq. ft. Mivan aluminum shuttering, high-speed passenger elevators, double-glazed unitized glass facades, high-grade stone/engineered wood finishes, VRV/VRF air conditioning provisions, and advanced clubhouse amenities.
- Super-Luxury / Ultra-Bespoke: ₹3,500 to ₹5,000+ per sq. ft. Imported marble, dynamic acoustic glass facades, custom architectural lighting, integrated home automation, and low-density structural framing.
For standard underwriting of an institutional, Grade-A high-rise, ₹2,500 per sq. ft. represents an accurate, conservative baseline for hard construction.
3. Statutory Levies and Infrastructure Charges (EDC & IDC)
Developers must remit substantial fees to local urban development authorities for external infrastructure: arterial roads, municipal sewage trunks, sector water supply lines, and electrical grids.
- EDC (External Development Charges): Levied by the state urban body to connect the development to master infrastructure.
- IDC (Internal Infrastructure Development Charges): Levied for localized intra-sector development.
- Conversion and Scrutiny Charges: Statutory planning and licensing fees.
These statutory costs are publicly declared on the project’s regulatory approval certificates and typically range between ₹1,200 and ₹1,600 per sq. ft. of saleable area in major metropolitan expansion corridors.
Real-World Case Study: Underwriting a Prime Gurgaon High-Rise
To understand this methodology in practice, let us examine an empirical case study drawn from a flagship high-rise development situated along a major growth corridor in Gurgaon, Haryana.
Project Baseline Data (Extracted from RERA Filings)
- Land Parcel Size: 7.5 Acres (approx. 30,351 sq. meters)
- Disclosed Land Acquisition Cost: ₹100 Crores (₹1,000,000,000)
- Total Permissible Saleable Area: ~670,000 square feet (across multiple residential towers)
- Declared EDC / IDC / Government Levies: ₹115 to ₹120 Crores
+--------------------------------------------------------------------------+
|                  EMPIRICAL UNDERWRITING BALANCE SHEET                    |
+-----------------------------------+--------------------------------------+
| Line Item Component               | Cost Impact (Per Sq. Ft.)            |
+-----------------------------------+--------------------------------------+
| Land Acquisition Cost             | ₹1,500                               |
| Hard Construction Cost (Grade-A)  | ₹2,500                               |
| Statutory Levies (EDC / IDC)      | ₹1,500                               |
| Base Direct Cost Subtotal         | ₹5,500                               |
| Goods & Services Tax (GST @ 5%)   | ₹275                                 |
| Admin, Sales & Corporate Overhead | ₹525                                 |
+-----------------------------------+--------------------------------------+
| Total Net Intrinsic Cost          | ₹6,300                               |
| Current Developer Asking Price    | ₹6,800                               |
+-----------------------------------+--------------------------------------+
| Developer Gross Profit Spread     | ₹500 (approx. 7.35%)                 |
+-----------------------------------+--------------------------------------+
The Analytical Verdict:
The developer’s public launch price was ₹6,800 per sq. ft.
When we evaluate this ask against our audited intrinsic cost base of ₹6,300 per sq. ft., the developer’s net operating margin on launch is approximately 7.35%.
In the equity markets, buying an asset trading within single digits of its net book value—especially one backed by an institutional balance sheet—represents an extraordinary safety margin. A margin spread this narrow indicates that the developer is pricing the project aggressively to accelerate absorption, generate operational cash flow, and de-risk construction debt.
For the buyer, this pricing creates an asymmetric risk-reward setup: downside exposure is structurally protected by the physical cost of reproduction, while upside capital appreciation remains unburdened by speculative markup.
The Critical Variable: Unit Density per Acre
When applying the Intrinsic Cost-Plus framework, land cost per square foot cannot be evaluated in isolation from density.
The total land cost amortized per apartment depends directly on the number of units the developer builds on the parcel:
$$\text{Density Ratio} = \frac{\text{Total Dwelling Units (DUs)}}{\text{Total Project Acreage}}$$
- High-Density Development (80 to 120+ units per acre): The physical land cost is divided among a massive volume of saleable units. While the land cost per square foot plummets, the liveability index, elevator wait times, common area wear-and-tear, and undivided share of land (UDS) per owner are compromised.
- Low-Density Development (20 to 40 units per acre): The land cost per square foot of saleable area will look substantially higher on the balance sheet. However, the buyer acquires a much larger Undivided Share of Land, superior structural privacy, and greater scarcity value.
The Golden Valuation Rule of Density: If an under-construction project has high density, its land cost per square foot must be low, and its sale price should reflect that efficiency. If a high-density project demands the retail pricing of a low-density sanctuary, walk away immediately.
Framework 2: Relative Valuation (The “Builder Floor” Arbitrage Matrix)
For investors who do not wish to audit engineering cost sheets, relative valuation provides a reliable, market-tested shortcut.
In high-growth micro-markets, gated multi-story developments frequently co-exist alongside mature residential sectors characterized by independent low-rise “builder floors” (typically four-story structures built on dedicated plots). Independent builder floors carry negligible community infrastructure: they lack Olympic swimming pools, security perimeters, clubhouse facilities, and power-backup substations.
Because builder floors trade purely on immediate utility and land-plus-brick value, they serve as a clean baseline for the pure residential value of that specific pin code.
+-------------------------------------------------------------------------------+
|                       THE BUILDER FLOOR ARBITRAGE MATRIX                      |
+-------------------------------------------------------------------------------+
|  Premium Over Nearby Floor   | Investment Rating | Analytical Action          |
+------------------------------+-------------------+----------------------------+
|  Under 10% Premium           | "Blind Buy"       | Instant capital allocation |
|  10% to 20% Premium          | Strong Buy        | Highly favorable risk/reward|
|  20% to 30% Premium          | Fair Value        | Standard purchase territory|
|  Above 30% Premium           | Overvalued        | High risk of stagnation   |
+-------------------------------------------------------------------------------+
The Spatial Rule: The 500m to 1,000m Radius Test
- Select the prospective high-rise multi-story development (e.g., a 3-BHK spanning 2,000 sq. ft.).
- Map a radius of 500 meters to 1 kilometer surrounding the site.
- Identify the prevailing transaction price for a newly constructed builder floor of identical carpet area within that localized perimeter.
Let the market clearing price of the independent builder floor equal $X$.
Evaluating the Premium Spreads:
1. The < 10% Premium Corridor: The “Blind Buy”
If an apartment in a master-planned, branded high-rise development—complete with round-the-clock security, treated water systems, recreational infrastructure, and professional facility management—can be acquired at a premium of less than 10% over an un-gated independent floor in the same neighborhood, it represents a clear buying opportunity.
At a sub-10% premium, the market is pricing the shared amenities, infrastructure, and brand equity at near zero.
2. The 10% to 20% Corridor: Strong Buy
This is the standard, healthy market equilibrium. A 10% to 20% premium accurately prices the lifestyle delta, clubhouse amenities, green spaces, and enhanced tenant demand commanded by a high-rise tower over an isolated street floor.
3. The 20% to 30% Corridor: Fair Value
At this level, future capital appreciation will depend strictly on overall micro-market infrastructure appreciation rather than value-unlocking arbitrage. You are paying a fair price for luxury, but leaving minimal instant equity on the table.
4. The > 30% Corridor: Speculative Danger Zone
If the developer demands a premium in excess of 30% over adjacent low-rise stock, you are paying a steep brand tax. Unless the project offers extraordinary structural scarcity (e.g., direct ocean frontage, adjacency to a central park, or historic zoning protection), this premium will compress upon handover.
The Time-Value Capital Advantage: Staggered Cash Flows
Relative valuation must also account for capital velocity.
Purchasing a completed builder floor demands 100% upfront capital disbursement within 30 to 60 days. You must either deploy liquid reserves or service full mortgage interest immediately.
Conversely, an under-construction project typically employs a Construction-Linked Payment Plan (CLP) or structured milestones (e.g., 20:40:40 or 25:25:25:25):
- Month 1–2: 20% initial capital commitment.
- Month 18–24: 40% milestone disbursement as structural slabs are cast.
- Month 36–48: Remaining 40% upon application for the Occupancy Certificate (OC).
Cash Flow Outlay Comparison Over 3 Years:

Builder Floor (Immediate Completion):
Year 0: [████████████████████████████████████████] 100% Capital Outlay

Under-Construction High-Rise (Structured CLP):
Year 0: [████████] 20% Outlay
Year 1.5:        [████████████████] 40% Outlay
Year 3:                          [████████████████] 40% Outlay (Handover)
By retaining 60% to 80% of your capital across the project’s construction runway, that capital can remain deployed in short-duration fixed income, arbitrage funds, or productive operating assets. This dynamic reduces your effective net present value (NPV) cost, tilting relative valuation even further in favor of the high-rise.
Framework 3: Resale Valuation & The “Exit Threshold” Multiplier
Valuing an under-construction asset is fundamentally an engineering and cash-flow forecasting exercise. Valuing a resale property older than 20 years is a capital preservation exercise.
All physical structures suffer from continuous economic and physical depreciation. Concrete undergoes carbonation, plumbing systems degrade, electrical conduits fail to support modern loads, and modern amenity expectations outpace vintage floor plans. While the underlying land value may appreciate, the structural value steadily trends toward zero.
Total Property Value = Appreciating Undivided Share of Land (UDS) + Depreciating Physical Structure
For older properties, retail sellers routinely fixate on emotional milestones, anchoring their asking price to peak market highs. As an investor, you must evaluate older assets through one metric: The Annual Rental Multiple.
+--------------------------------------------------------------------------+
|                     THE 35-40X ANNUAL RENTAL EXIT RULE                   |
+--------------------------------------------------------------------------+
|  Annual Gross Rental Yield (Current):  ₹3,00,000 per year                |
|  Target Multiple Threshold:           35x to 40x                         |
+--------------------------------------------------------------------------+
|  Lower Bound Valuation (35x):         ₹1.05 Crores (₹10,500,000)         |
|  Upper Bound Valuation (40x):         ₹1.20 Crores (₹12,000,000)         |
+--------------------------------------------------------------------------+
|  STRATEGIC DIRECTIVE:                                                    |
|  If an outside buyer offers >= ₹1.20 Cr, LIQUIDATE THE ASSET IMMEDIATELY. |
|  The asset is yielding a sub-2.5% gross return; structural depreciation   |
|  will outpace rental growth over the next economic cycle.                |
+--------------------------------------------------------------------------+
The 35x to 40x Exit Multiplier Rule
If you own a residential property that is 20 years of age or older, calculate your total annual gross rental income:
$$\text{Gross Annual Rent} = \text{Monthly Rent} \times 12$$
If the broader secondary market offers you an exit price equivalent to 35 to 40 times that annual rental figure, your decision is clear: sell the asset immediately.
The Financial Mechanics Behind the Rule:
A purchase price equal to 40 times annual rental income implies a Gross Rental Yield of just 2.5%:
$$\text{Gross Rental Yield} = \frac{1}{40} = 2.5%$$
Once you factor in:
- Property taxes,
- Escalating sinking-fund maintenance contributions,
- Periodic tenant turnover vacancies, and
- Interior restoration cap-ex,
your Net Rental Yield collapses to between 1.2% and 1.7%.
Holding a depreciating physical structure for an effective yield under 2% is capital misallocation. The risk-free rate of return on sovereign government debt sits vastly higher.
Furthermore, the likelihood of an aging 20-year-old apartment complex generating substantial capital appreciation over the subsequent decade is low. The building sits on a downward architectural lifecycle curve.
When an optimistic retail buyer offers you 40 times rent, they are effectively paying you for 40 years of rental income in advance, without requiring you to manage the property or fund structural upkeep. Take the liquidity and redeploy the proceeds into modern, high-yield commercial assets, infrastructure trusts, or lower-basis under-construction projects.
Structural Comparison: High-Rise High-Density vs. Low-Rise Builder Floors
Understanding how physical layout affects financial performance helps clarify the trade-offs between asset classes:
| Valuation Metric | Master-Planned High-Rise (Under-Construction) | Independent Builder Floor (Low-Rise Completed) | Vintage High-Rise (20+ Years Old Resale) |
|---|---|---|---|
| Information Transparency | Very High (Regulated RERA Filings) | Low to Moderate (Local Registry Estimates) | Moderate (Historical Resale Deeds) |
| Primary Valuation Tool | Intrinsic Cost-Plus Allocation | 500m Relative Floor Arbitrage | 35x–40x Rental Yield Multiplier |
| Undivided Land Share (UDS) | Lower (Distributed over height) | High (Direct proportional plot share) | Medium to Low |
| Liquidity Velocity | High during early & delivery phases | Moderate (Limited to local end-users) | Low (Diminishing buyer pool) |
| Depreciation Risk | Zero (Asset is newly built) | Medium (Bespoke construction quality) | Severe (Aging MEP & structural wear) |
| Capital Deployment Style | Staggered over 36–48 months | 100% Upfront Capital | 100% Upfront Capital |
| Ideal Holding Period | Launch to +3 Years Post-Handover | 5 to 7 Years (End-User Driven) | Liquidate immediately if threshold hit |
Practical Application: The 8-Step Buyer’s Due Diligence Workflow
Before executing a purchase agreement or wiring earnest money for a residential property, follow this structured underwriting process:
+-----------------------------------------------------------------------------+
|                      DUE DILIGENCE WORKFLOW CHECKLIST                       |
+-----------------------------------------------------------------------------+
| [Step 1] Download the project's official Statutory Registration File.       |
|          Verify registration validity, bank escrows, and planned delivery.  |
|                                                                             |
| [Step 2] Isolate Land Acquisition Cost and Sanctioned Built-Up Area.        |
|          Compute exact Land Cost per Saleable Sq. Ft.                       |
|                                                                             |
| [Step 3] Benchmark Hard Construction Costs based on project tier:           |
|          Value: ₹2,000/sq.ft | Grade-A: ₹2,500/sq.ft | Luxury: ₹3,500/sq.ft |
|                                                                             |
| [Step 4] Add Statutory Charges (EDC/IDC) and Government Levies.             |
|          Sum: Land + Civil Build + Stat Levies = Direct Intrinsic Floor.    |
|                                                                             |
| [Step 5] Compare Intrinsic Base against Developer's Asking Price.           |
|          Look for an entry point within 5% to 8% of this cost floor.        |
|                                                                             |
| [Step 6] Run the 1km Builder Floor Relative Arbitrage Check.                |
|          Ensure high-rise premium remains under 20% of floor pricing.       |
|                                                                             |
| [Step 7] Model Cash-Flow NPV using the Payment Plan Milestones.             |
|          Account for time-value benefits of staged disbursements.           |
|                                                                             |
| [Step 8] Define your Long-Term Exit Horizon:                                |
|          Target a profitable lifecycle exit before the building hits 20 yrs |
|          unless supported by rare, irreplaceable land dynamics.             |
+-----------------------------------------------------------------------------+
The Strategic Importance of Real Estate Financial Literacy
Residential real estate marketing often relies on emotional appeals: prestige, social status, and lifestyle signaling. While these factors matter for personal enjoyment, they should never serve as the foundation for your underwriting.
When you train yourself—and the next generation of investors—to ignore marketing rhetoric and focus on regulatory filings, land-cost allocations, comparative construction benchmarks, and rental multipliers, the entire real estate market shifts into focus.
Real estate is not an impenetrable, subjective domain reserved for developers and well-connected insiders. Stripped of glossy brochures and marketing suites, it is a manufacturing business: raw land is acquired, statutory taxes are paid, concrete and glass are assembled, and a finished product is delivered.
By mastering the Intrinsic Cost-Plus Formula, the Relative Floor Arbitrage Matrix, and the 40x Rental Exit Rule, you gain an institutional decision-making edge. You protect your downside capital, avoid market bubbles, and secure assets at prices that position you for sustained, multi-generational returns.
Frequently Asked Questions
How do you calculate the intrinsic land cost per square foot from a RERA filing?
Divide the total documented land acquisition cost by the total sanctioned saleable (built-up) area disclosed in the developer's statutory RERA application.
What is the acceptable price premium for a branded high-rise versus a local builder floor?
A branded high-rise offering gated security and lifestyle amenities is a 'blind buy' at a premium under 10%, a strong buy between 10% and 20%, fairly valued up to 30%, and speculative beyond 30%.
When should an investor sell a residential property older than 20 years?
Liquidate aging residential assets whenever the market offers an exit price equivalent to 35 to 40 times the property's gross annual rental income.
Written by
The OD Team
Main Writer & Editorial Team
The OD Team is the core writing and editorial team behind The Orange Desk. We research, write, fact-check and update every guide on money, technology and everyday decisions, so you get clear, practical answers you can act on.
View full profile →